Most things sound blue-green
Scientific Synaesthesia — converting sound to colour
So following on from my previous post about producing sound from weather, I decided to try to swap a different part of our experiences spectrum. This time I wanted to see sound.
It’s well documented that some people naturally experience Synaesthesia — a neurological phenomenon where one sense (hearing, sight, touch) receives stimulation (through sound, light or touch) but the stimulation is simultaneously experienced with a different sense. It’s a fascinating condition/ability that can be incredibly useful. Someone with a specific type of synaesthesia who sees colours associated with numbers might see the picture to the left in the same way that we see the picture to the right:

When people have Synaesthesia, they generally don’t have it in the exact same way. So for example, two people with numerical to colour Synaesthesia probably won’t associate the same colour with the same number and two people with sound to colour Synaesthesia won’t see the same colour when they hear the same sound. I thought it would be cool to make a process which in a more replicable way takes something that we normally experience with one sense (in this case sound) and turns it into something we can experience with another sense.
Fourier analysis
I wanted to take a set of frequencies of various loudness and convert them into a set of light wavelengths of various brightness. To do this I first needed to work out what frequencies were present in my sound sample and how loud they were. Fourier transforms are awesome for this, they turn complicated soundwaves over time…

…into a sound spectrum:

The graphs above say that if I make sinewaves from each of the frequencies above with their associated loudness and add them all together into one big noise, it should sound like the average of the original sound sample.
Using this spectrum and normalising the loudness (the units of loudness and the units of brightness of light are not very comparable), I can transform the frequency spectrum (f) of human hearing into the wavelength spectrum of human sight (lambda) using the formula below:
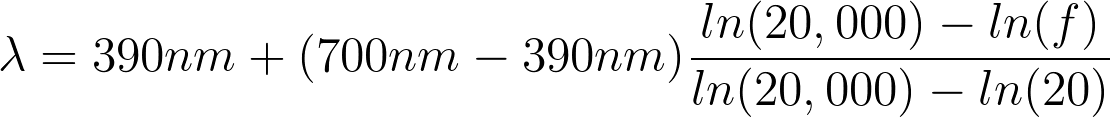
Human hearing is logarithmic, meaning that doubling the frequency of a tone increases the pitch that we hear by one octave. But human perception of colour is linear with respect to wavelength (i.e. doubling the wavelength changes the colour we see by a lot). I account for this by using the natural logarithm in the transformation above. If I didn’t do this, the highest octave that we can hear (10kHz — 20kHz), which only accounts for about ten percent of our hearing range in terms of pitch, would account for half of all the colours we can see.
This formula transforms the frequency spectrum into a wavelength spectrum:

Seeing spectra
The next problem is working out what colour our eyes would see if an object emitted this spectrum of light. When we look at something of a certain colour, we don’t actually just see one wavelength of light corresponding to that colour. Instead, nearly everything (except lasers and some other specific processes) sends out a whole bunch of wavelengths of light at the same time with different brightnesses. Our eyes and visual processing centres in our brains then take that spectrum and simplify it down into one perceived colour.
This is a surprisingly complicated problem, but luckily people have been thinking about this for ages. I used the International Commission on Illumination’s (such an epic name, but confusingly abbreviated “CIE”) 1964 standard colour tables for this. They figured out a way of measuring where on the spectrum and at what brightnesses we see three primary colours. The coloured lines below show at what brightness the various wavelengths of light map onto three primary colours (kind of — a better but more complicated explanation can be found here). By multiplying these curves by our spectrum, adding them all together and then transforming them into the RGB colour space (which is what computers use) we can turn our spectrum into a colour.
Seeing music
So what does this actually look like? Well, my favourite ten seconds (49–59 seconds in) of Alabama Shakes: Sound & Colour look like this:

I also thought I’d do my favourite ten seconds from the five songs from my post a few weeks ago:
, DJ Shadow ft. Run The Jewels — Nobody Speak (10–20 seconds in), swim good x Merival— since you asked (55–65 seconds in), Shirt — Phantom (25–35 seconds in), Son Little — Lay Down (95–105 seconds in), Royce Wood Junior — Clanky Love (57–67 seconds in)")
Left to right: Alabama Shakes — Sound & Color (49–59 seconds in), DJ Shadow ft. Run The Jewels — Nobody Speak (10–20 seconds in), swim good x Merival— since you asked (55–65 seconds in), Shirt — Phantom (25–35 seconds in), Son Little — Lay Down (95–105 seconds in), Royce Wood Junior — Clanky Love (57–67 seconds in)
On average, most things sound blue-green
Something that I find interesting is that if we take the same six songs from above, and use the full song instead of just ten seconds, they look like this (left to right in the same order as above):

This is due to that the Fourier transform we use earlier essentially finds the average spectrum over time, meaning that it becomes quite sensitive to how long the time-window is that we are averaging over. In this case, the longer the time window is, generally the more blue-greenish the colour becomes. This makes sense as green is in the middle of the spectrum and most music that we like listening to will probably not contain too much bass or treble, and so will average out to be in the mid-frequencies. The cool part is that green is also the colour that our eyes can see the most variety and subtle differences in — mainly due to us evolving in nature with many thousands of shades of green from the plants around us. So in a similar way, the equivalent of green in sound is the mid-frequencies which is an interesting parallel between the senses.
Thanks & next steps
During this project I found the following sites unbelievably helpful:
http://www.brucelindbloom.com/
International Commission on Illumination
ColorPy
The next step for me is to try to learn how to make this dynamic — i.e. using a moving time-window through time. This way we can see the colour that corresponds to the near-instantaneous sound spectrum that we would hear if the song were playing.